**This is an old revision of the document!**
Table of Contents
Spectrum analyzer example
Sometimes you want to know what's happening in the testbed, and for this you need a spectrum analyzer. Luckily we have done almost all the work for this, thanks to FFT web (all the technical details are explained in the link).
In this tutorial we won't talk about how FFT Web works, but instead how to integrate it within a scenario. For this we will be using the first tutorial. As a reminder, in this example we have two nodes doing an OFDM transmission, and now we want to analyze the spectrum during the transmission.
Setup
If it's not already done get our examples repository on github :
you@yourpc:~$ git clone https://github.com/CorteXlab/examples.git
you@yourpc:~$ cd examples
Duplicate the folder my_task and rename it as ofdm-sa :
you@yourpc:~/examples $ cp -f my_task/ ofdm-sa/
you@yourpc:~/examples $ cd ofdm-sa
Of course you need the CorteXlab OOT module to be installed, but it can also be found on github.
Create the Spectrum Analyzer script
We are going to create the SA script using GNU Radio Companion. Create a new flow graph and save it as sa.grc in the ofdm-sa folder.
First open the Option block and change the id for 'sa' and the Generate Options for 'No GUI'. Set the variable samp_rate to '2000000' (2Mhz).
We are going to use a USRP to run the script so add a UHD: USRP Source block. Open it to edit its properties. Set the sample rate to 'samp_rate' (without quotes). In the RF Options tab, set the Center Freq to '2490000000' (2.49Ghz), the Gain Value to '20' and the Antenna to 'TX/RX'.
Add an FFT Web block (from the CorteXlab module). Open it and set power max to '-50', power min to '-100', sample rate to 'samp_rate' and port to '6664'. You can find all the informations about how to tune this block in its wiki documentation page. Connect the two blocks together, and…. that's all ! Generate the flow graph and we are done for this part. Easy, isn't it?
Adapt the scenario file
We need to adapt the scenario file to include the spectrum analyzer. We are using nodes 4 and 6 to do the OFDM transmission, and if we look at the Nodes Placement Map, we see that for example node 23 is a good candidate to execute the spectrum analyzer script.
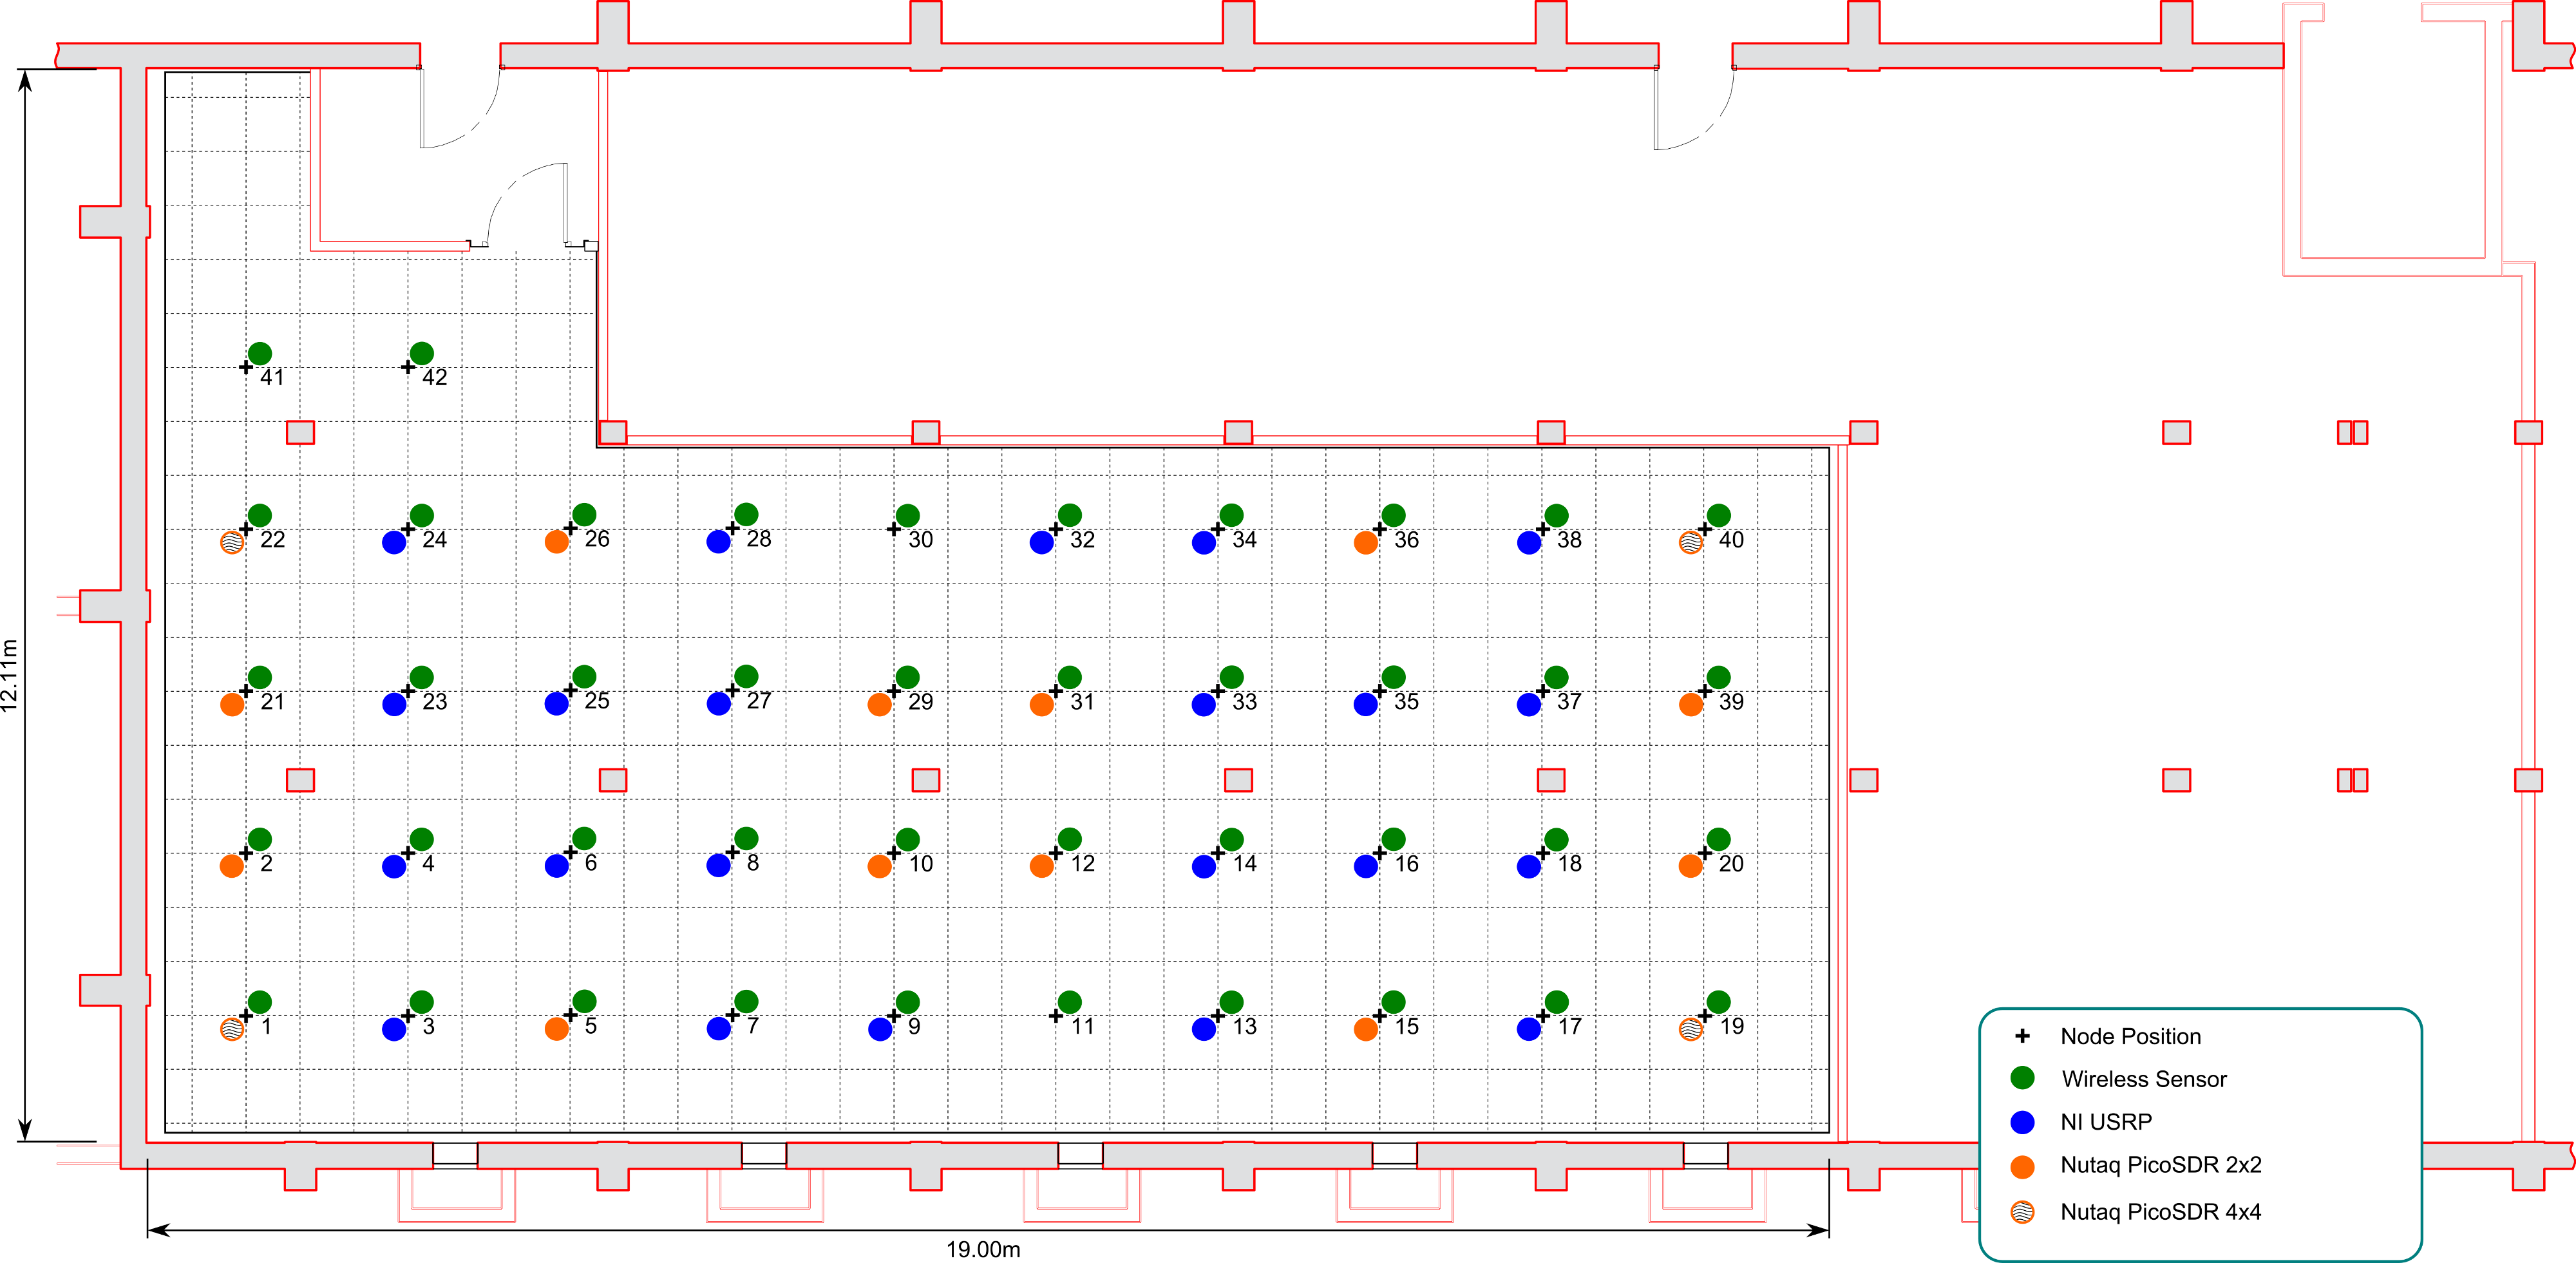
Edit scenario.desc to add the node 23 with 'sa.py' as the entry point. Also increase the number of packets sent by node 6 (option -M). Your file should look like this :
# Example scenario description file
#
#   All lines starting with "#" and empty lines are ignored


# Scenario textual description
#   simple string (a one liner)
desc base scenario for CorteXlab

# Experiment maximum duration
#   Time after which the experiment is forced to stop
#   integer (minutes)
durat 5

# Node list
#
#   format:
#
#   (machine):
#   entry (entry point script relative to the task root)
#   exit (exit point script relative to the task root. Use "none" for none)

node4:
   entry benchmark_rx.py
   params --antenna="TX/RX" --rx-gain=25 -v -W 2M -f 2.49G
   passive true

node6:
   entry benchmark_tx.py
   params --antenna="TX/RX" --tx-amplitude=0.2 -v -W 2M -f 2.49G -M 10

node23:
   entry sa.py
   passive true
Prepare the graph
Go to http://xp.cortexlab.fr/fft/. Set UDP Port to 6664, mean window to 10 (you can also set it to 1 for a more dynamic result), x_min to -1, x_max to 1, y_min to -100 and y_max to -50. Click on 'New graph'. Your graph should now appear.
Launch the experiment into CorteXlab
Upload your files on airlock
Upload the ofdm-sa directory on Airlock as explained here. For example for Linux it will look like this :
you@your-pc:~$ scp -P 2269 -r path/to/ofdm-sa username@gw.cortexlab.fr:~
Create the task
Connect to Airlock through ssh as described here. For example for Linux it will look like this :
you@yourpc:~$ ssh -p 2269 username@gw.cortexlab.fr
You can find in your home directory the ofdm-sa previously uploaded directory.
Now, use the Minus CLI to create the task file:
you@srvairlock:~$ minus task create ofdm-sa
The success (or failure) of the creation will be printed on screen. The task file will be created at the same level and with the same name as the targeted experiment folder but with a .task suffix, in our case ofdm-sa.task.
Note: You can get help on the Minus CLI at anytime with minus -h
Book the testbed with OAR
As explain here, we need to book the testbed with OAR in order to run our experiment. Once you have booked the platform, you will be the exclusive user of the testbed, avoiding experimentation interference.
A basic example to submit an OAR interactive job requesting all available nodes, for 30 minutes:
$ oarsub -I -l nodes=BEST,walltime=0:30:00
Submit the task
Now, we have booked the testbed and we have a .task file containing our experiment. In order to run it, we need to submit it to the testbed scheduler.
For now, the scheduler is a simple FIFO queue, but a more advanced scheduling mechanism will be implemented in upcoming versions of CorteXlab.
To submit a task to the scheduler, use the Minus CLI:
you@srvairlock:~$ minus task submit ofdm-sa.task
On screen will be prompted the id of your task in the scheduler. Note it down so that you can easily retrieve your results or monitor the progress of the experiment.
Observe the result
Go back to the web page where we created the graph. Around twenty seconds after launching the experiment the graph should start to animate with the result and you can observe a graph representing an OFDM transmission which should look like this :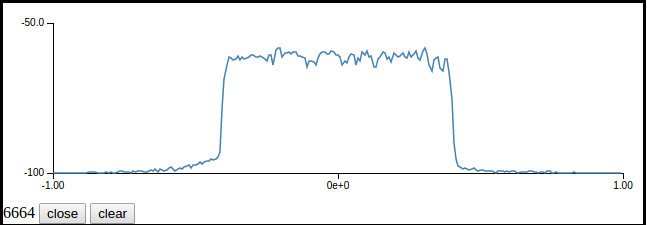
What's next
You can try to put several spectrum analyzers within the testbed on different nodes in order to see how the signal strength spreads.
You can also put the FFT Web block directly in your receiver node if you don't want to use another node.